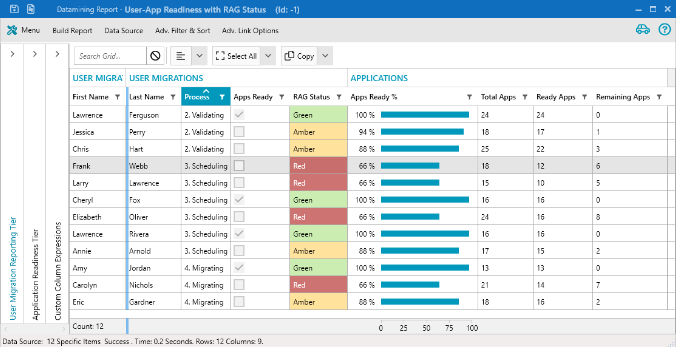
Adding a splash of colour to a Datamining Report (DMR) is a great way to pick out important details in data-rich reports. ManagementStudio offers Colour Column Expressions as a way to colour cells based on simple rules. For example:
- If 100% of a user’s applications a ready, then colour that user green
- If 70+% of the applications are ready, then colour the user amber
- For any other value, colour the user red
Building a Colour Expression
- On the DMR ribbon click Add Expression Columns
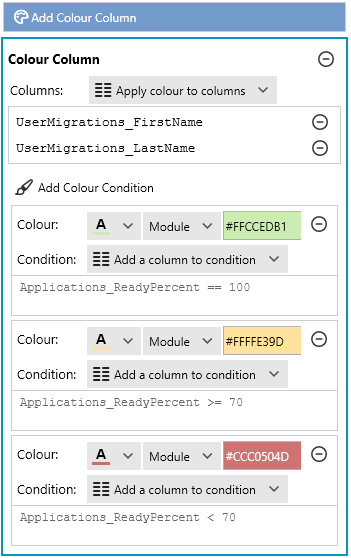
- Click Add Colour Column
- Select the columns to apply the colour condition to
- Multiple columns can be colored using the one colour condition
- Note: If no columns are visible run the DMR to build the columns
- Click Add Colour Condition for each colour to add
- i.e., If you plan to add 3 colours – green, amber, and red – you’ll need 3 conditions
- Specify the colour to use
- The middle dropdown selects different colour pallets to choose from
- A hexadecimal colour code can be typed in directly
- Or enter an HTML colour name instead of the hex code
- Add a Condition
- Conditions apply to columns
- Use the Add a column… dropdown to get the column names
- Create a rule. E.g. Applications_ReadyPercent >= 70
- Checks supported:
- == (equals)
- <> (not equals)
- >, >=, <=, < (greater, less etc)
- .Contains()
- .EndsWith()
- Repeat step 6 for each colour to add
- Run your DMR and enjoy your new colorful report!!
Final Thoughts
Colour helps you to easy identify key information in your Datamining Reports. For more examples of working with DMRs, check out our Solution Article. If you have any questions about using colour in your DMR, head over to our Support Portal where you can search for related articles or raise a support ticket.


